Only Progress Bar is visible in preview. Actual discounts dont work on Preview mode. It is only to understand how Progress bar will display on your site
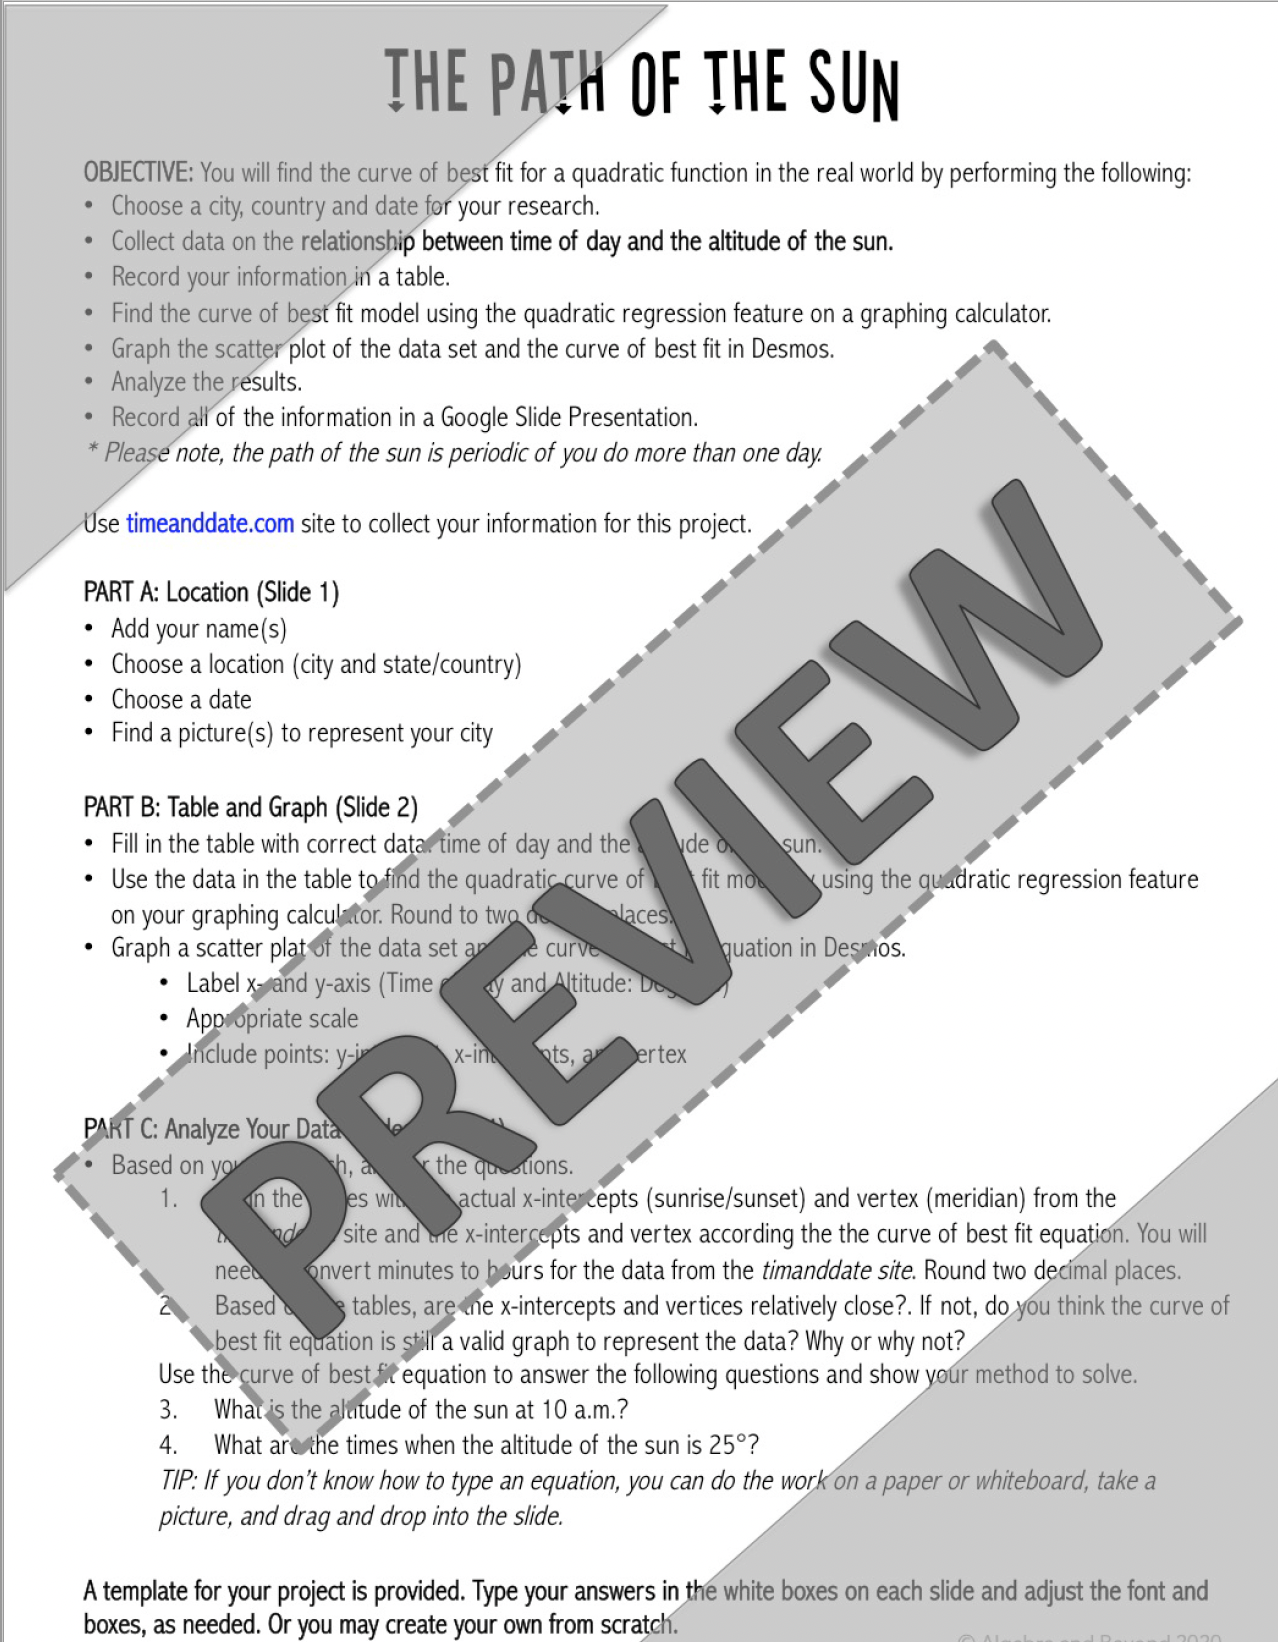
Students will demonstrate their knowledge and understanding of finding the quadratic model that best fits data in a real-world setting by performing the following:
Choose a city, country, and date for your research.
Collect data on therelationship between time of day and the altitude of the sun.
Record your information in a table.
Find the curve of best fit model using the quadratic regression feature on a graphing calculator.
Graph the scatter plot of the data set and the curve of best fit in Desmos.
Analyze the results.
Record all of the above information in a Google Slide Presentation
INCLUDES:
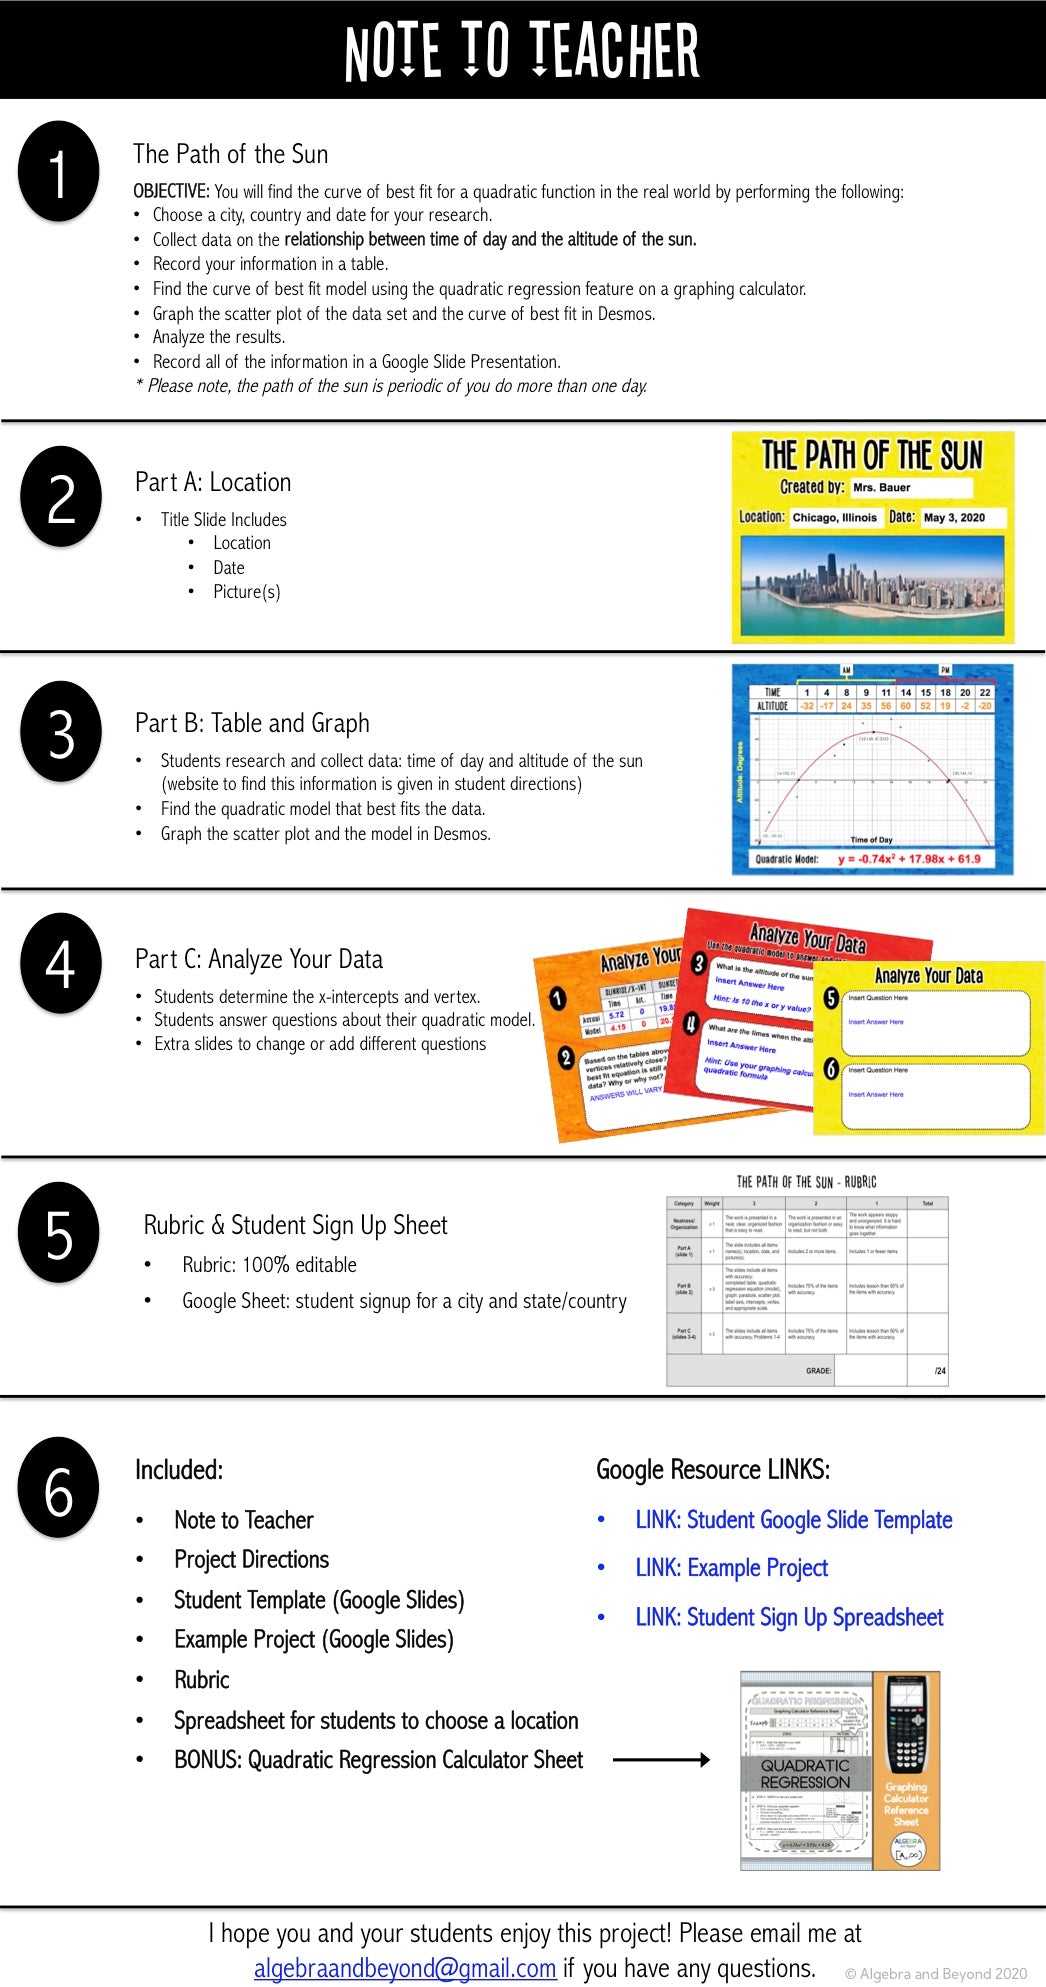
Note to Teacher (see preview)
Project Handout - 100% Editable
Student Google Slides Template
Example Google Slides Presentation
2 Videos: Quadratic Regression on TI-84 calculator & Graphing in Desmos
Students are able to demonstrate their knowledge and understanding of math in real world settings. Authentic projects that can be used as individual or group work. Project based learning is perfect to integrate within a unit of study or used as a summative assessment.
Details
INCLUDES
• Note to Teacher describing how to use the project • Student handout (editable) • Rubric (editable)
*Some projects include extra handouts and/or videos
Using this resource allowed me to differentiate more effectively, offer students structured practice, and introduce concepts in a more interactive way.
M
Max S.
Great performance assessment and/or PBL assignment
My students were able to show their knowledge of Quadratic Regression in a defined way without needing to test them using this resource. I liked that they were able to do this using a real-world application. The included rubric was really helpful!
A
Angela M.
Great way to end the unit! Easy format for kids to follow.
D
Donna B.
I used this as an enrichment activity with my honors algebra 2 students. It was clear and engaging. Very pleased. Thank you.
R
Rachel A.
I have used this problem 3 times now and students love it! Any chance to connect functions to real-world data is a win.
I am always trying to create or find projects where each students' project will be different than every other students in the class because it is more authentic this way. And of course, I want it to be applicable in the real world! This is not always easy to make because if every student’s project is different, or even has an unlimited number of solutions, checking each one is extremely difficult and time-consuming for the teacher. Well, guess what?!...these projects are authentic.